阅读理解。
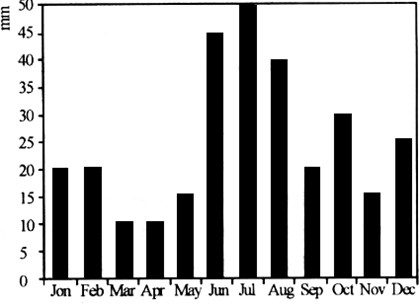
Think about your hometown. Does it get a lot of rain in summer? How much rain is normal? Rainfall can
varyfrom year to year. Therefore, it is important to find the average (平均值) The following chart shows the
average rainfall in a city for each month over ten years.

From the chart, we can see that spring is the driest season. During March, April and May, the average
total rainfall for the whole season is 35 mm. Summer is the wettest season of the year. July has the most
rainfall during this season. In both autumn and winter, there is moderate rainfall, with autumn having a little
more rain than winter.
1. This chart shows _______ each month.
A. the amount of rain
B. the rain farmers need
C. the wettest season of the year
D. the water people used
2. Which season is "the rainy season"?
A. Spring.
B. Summer.
C. Autumn.
D. Winter.
3. What does the underlined word "vary" mean?
A. show
B. increase
C. drop
D. change